10
Classification
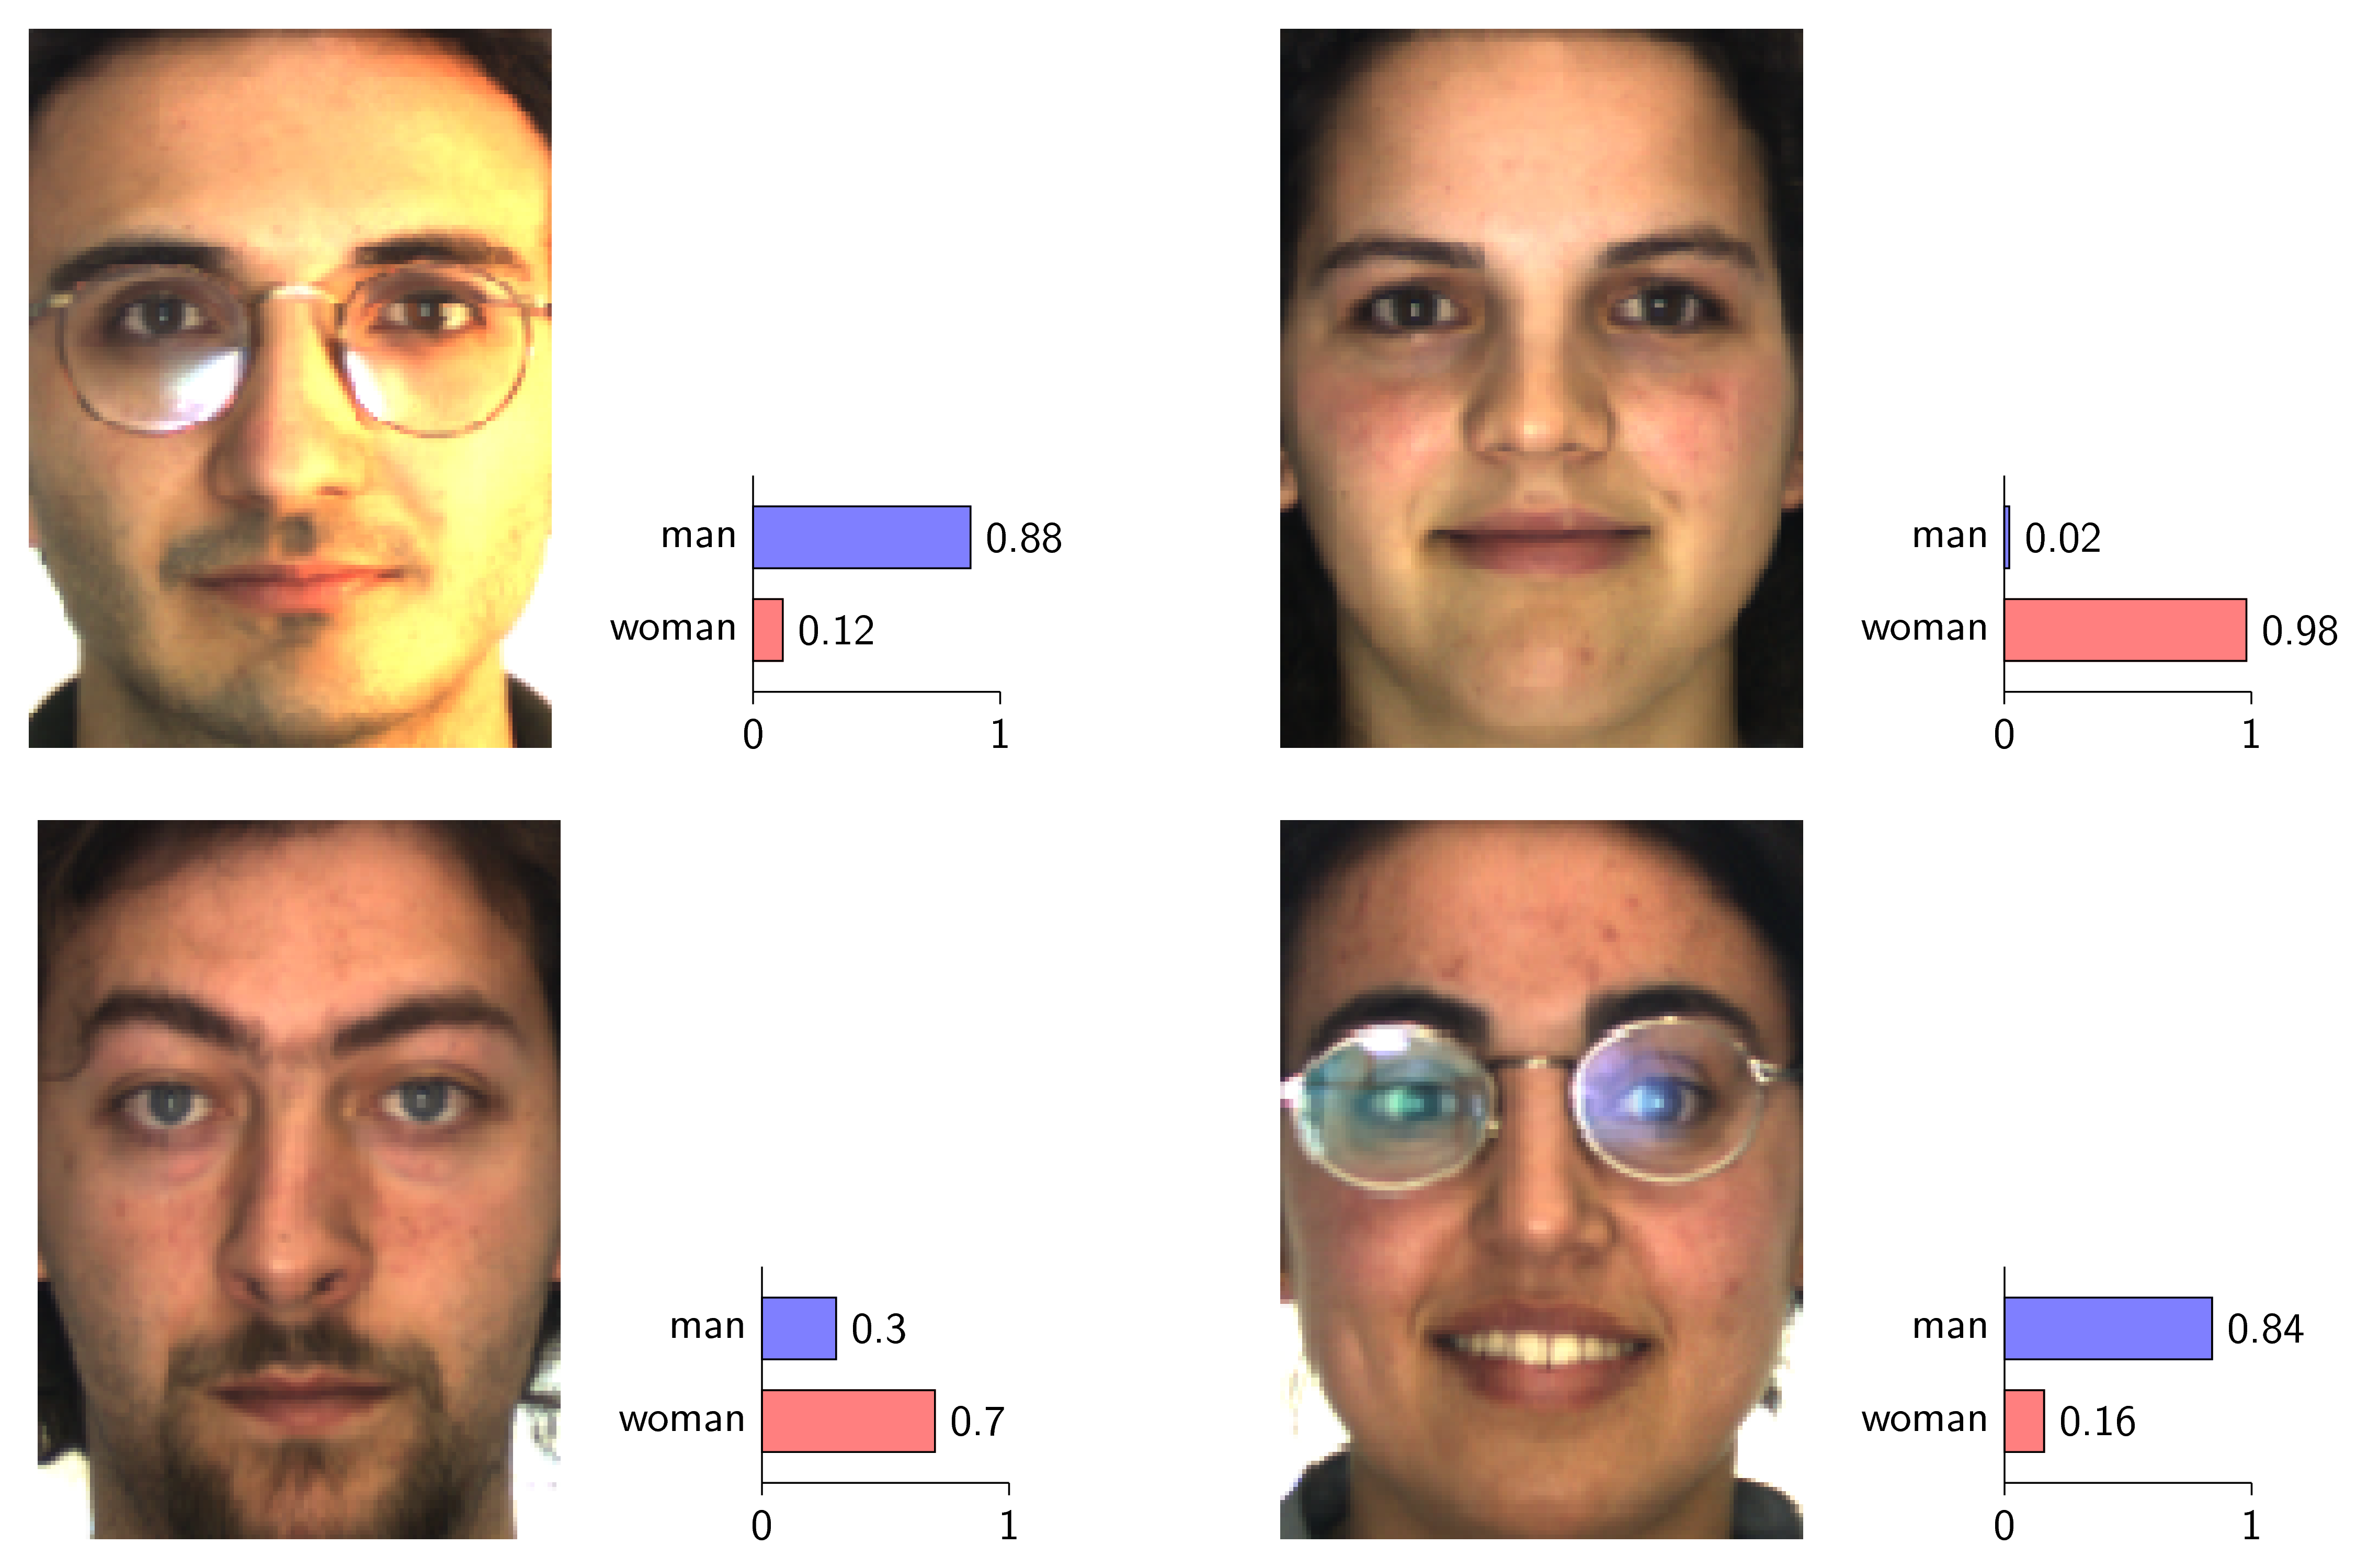
Binary Classifiers
Theory
Binary classification involves categorizing data into one of two classes. Understanding evaluation metrics is crucial for assessing model performance beyond simple accuracy. Different metrics emphasize different aspects of performance (precision vs recall).
Visualization
Mathematical Formulation
Evaluation Metrics:
• Accuracy: (TP + TN) / Total
• Precision: TP / (TP + FP)
• Recall: TP / (TP + FN)
• F1 Score: 2·(Precision·Recall)/(Precision+Recall)
• ROC-AUC: Area under ROC curve

Confusion Matrix:
          Predicted
          0    1
Actual 0  TN   FP
       1  FN   TP
Code Example
from sklearn.metrics import (accuracy_score, precision_score,
                             recall_score, f1_score,
                             roc_auc_score, confusion_matrix)

# Assume y_true and y_pred from model
y_true = [0, 1, 1, 0, 1, 1, 0, 0, 1, 0]
y_pred_proba = [0.1, 0.8, 0.7, 0.2, 0.9,
                0.6, 0.3, 0.15, 0.85, 0.25]
y_pred = [1 if p >= 0.5 else 0 for p in y_pred_proba]

# Calculate metrics
print(f"Accuracy: {accuracy_score(y_true, y_pred):.3f}")
print(f"Precision: {precision_score(y_true, y_pred):.3f}")
print(f"Recall: {recall_score(y_true, y_pred):.3f}")
print(f"F1 Score: {f1_score(y_true, y_pred):.3f}")
print(f"ROC-AUC: {roc_auc_score(y_true, y_pred_proba):.3f}")

print("\nConfusion Matrix:")
print(confusion_matrix(y_true, y_pred))